
Economic Prosperity
One key to economic growth is ensuring that workers with a broad range of skill sets have stable access to regional employment opportunities. Expansive, integrated transit networks and transit-supportive development provide more diverse economic opportunities than individual transit lines, and can therefore support upward mobility and help the region better weather economic fluctuations. Recent trends indicate that workers increasingly prefer to live near where they work and enjoy a higher quality of life that is free from the strains of traffic and congestion, making jobs and housing near transit an increasingly popular choice. Moreover, connecting dense job clusters by transit has been shown to have a greater impact on boosting transit ridership than increasing residential density.5
|
Region |
Transit |
% Employment within 1/2 mile of Fixed-Guideway Transit |
|
Phoenix, AZ |
Small |
11.2 |
|
Atlanta, GA |
Medium |
13.7 |
|
Minneapolis - St. Paul, MN |
Medium |
19.6 |
|
Los Angeles County, CA |
Large |
22.5 |
|
Philadelphia, PA |
Extensive |
29.8 |
|
Portland, OR |
Large |
33.8 |
Sources: U.S. Census Bureau Longitudinal Employer Dynamics, 2006; Center for TOD
Portland already outperforms many regions when it comes to linking regional job destinations into its transit network. Over a third of the region’s jobs are within a half mile of a rail station, exceeding even Philadelphia which has a much larger existing transit system (Figure 6). When frequent bus corridors are added in, 45 percent of regional jobs are readily accessible by quality transit.6
Comparing Portland’s job distribution to other regions illustrates the extent to which the region enjoys a relatively monocentric employment pattern. Figure 8 shows the distribution of jobs in each census block relative to the region’s light rail system and Metro’s designated centers. Figure 7 shows the job distribution within other regions, such as Atlanta, which have experienced more employment growth at the urban edge thus making it nearly impossible to connect a large share of regional jobs to transit.
Figure 7: Comparative distribution of jobs in other regions

Click to enlarge
Figure 8: Distribution of jobs relative to transit communities and designated centers 
Click to enlarge
Though Portland does outperform most regions due to a continued heavy concentration of center city employment, over half of the region’s jobs remain beyond walking distance of a station or frequent bus line. Many of the major suburban job centers are outside walking distance of light rail stations and often lack quality “last mile” transit, biking, and walking connections. Enhanced pedestrian/bicycle connections and future new transit alignments can help connect some of the region’s outlying job centers, but the reality is that there will always be some less connected job centers, leaving some commuters with limited options beyond driving.
Safe, Reliable Transportation
Residents in communities with reduced auto-dependence own fewer cars and use them less. This yields multiple benefits, including:
- More stable transportation costs, even when gas prices increase;
- Higher household disposable incomes, more likely to be circulated within the local economy;
- A reduced need to expand freeways or other road infrastructure to accommodate new growth;
- Healthier residents as a result of more physical activity, which reduces both individual health care costs as well as public health expenditures; and
- A more stable and sustainable source of transit ridership, which leads to additional fare box recovery and revenue for transit agencies.7
Portland is a national model for providing diverse transportation options to local citizens. Its existing bike ridership and annual transit trips per capita are among the highest in the country. However, the most robust transit service and pedestrian/bicycle networks naturally tend to be concentrated primarily in the region’s historic downtowns and former streetcar neighborhoods. Other parts of the region are left behind in terms of enjoying the transportation connections, urban design, and land use patterns that foster independence from single occupancy vehicles.
Click to enlarge
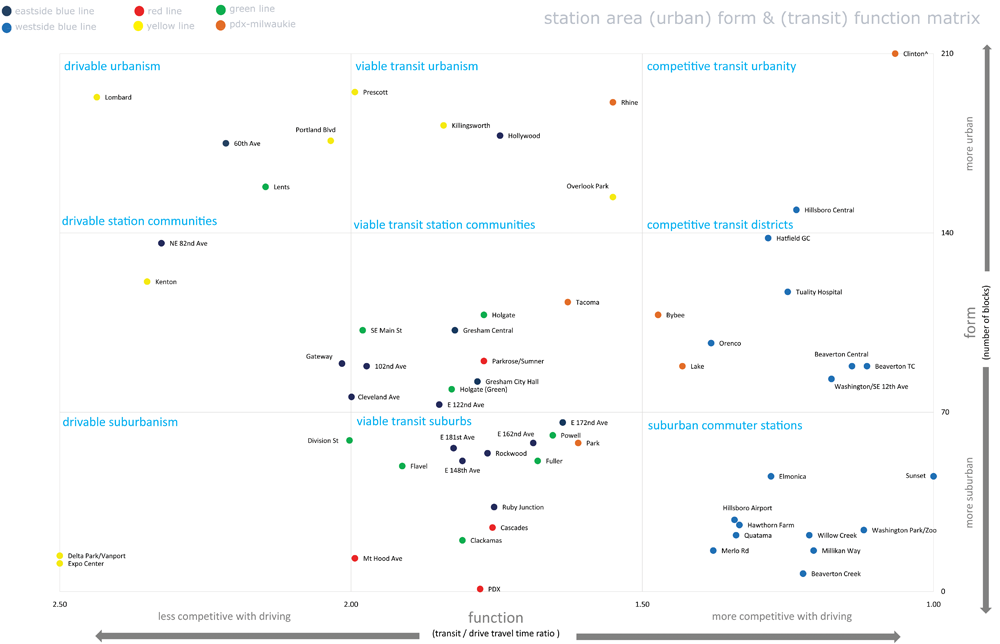
Moreover, not all of the region’s station areas offer significant travel time savings to commuters going to the downtown. Figure 10 shows the ratio of transit time to drive time to downtown by station, a common measure of transit competitiveness, and overlays this information with block size as a proxy for walkability. Even when accounting for average vehicular congestion delay, the transit travel times for a majority of the station areas is 50 percent greater than driving times. A large number of these station areas also have lower block densities, thereby further diminishing transit competitiveness by limiting accessibility.
Notably some of Portland’s most walkable neighborhoods have less competitive transit times, which may deter commuters from getting out of their cars even as they walk or bike to shopping and services within their neighborhoods. This helps explains why over the last decade transit mode share has been relatively constant in the Portland Region while bicycle mode share has increased, particularly in Portland and communities east of the Willamette River. This trend is likely attributable to the investment in cycling infrastructure, making riders more comfortable riding on street, and the travel time and cost competitiveness of cycling for trips under three to four miles. For a commuter traveling from an inner east side Portland neighborhood, a cycling trip may take 30 to 50 percent less time than a transit trip. Indeed, transit accessibility and the cycling network are mutually supportive and should both be jointly considered in planning and evaluating investments.
Equity
Achieving the 2040 Growth Concept will require a significant amount of the region’s growth to occur in transit-rich centers, corridors and station communities. As of 2000, only 12 percent of the region’s households lived within ½-mile of rail station areas. A key challenge for the region will be to direct more of its growth to the region’s highly accessible transit communities, including station areas, suburban centers and quality bus corridors. Moreover, developers will need to build near the region’s high quality bus corridors in order to maximize transit rich housing opportunities. This new development near transit will need to serve the full range of household types living in the region, including both family and nonfamily households, households of all income levels, and people with mobility impairments or special transportation needs.
|
Portland |
Station |
|
|
Housing only |
29% |
22% |
|
Transportation only |
21% |
18% |
|
Combined Housing and Transportation |
50% |
40% |
Source: Housing + Transportation Affordability Index®, CTOD
Financially constrained households must weigh the costs of living in different neighborhoods—costs that that cannot be accurately estimated unless one combines the local cost of housing with the local cost of transportation. Transit-rich areas offer lower transportation costs than auto-oriented locations by providing increased access to regional job centers and other important destinations in walkable neighborhoods such as grocery stores. The American Public Transportation Association reports that riding public transit saves Portland residents an average of over $9,500 a year in transportation costs.8 And households living near transit are five times more likely to use transit than other households. Households living within ½-mile of rail transit in the Portland region already spend about 10 percent less of their household budgets on the combined cost of housing and transportation than the average household in the region, as shown in Figure 9.
|
2000 Household Income |
Station Areas |
Region |
|
< $20,000 |
29% |
18% |
|
$20,000 - $34,999 |
23% |
19% |
|
$35,000 - $49,999 |
17% |
17% |
|
$50,000 - $74,999 |
17% |
22% |
|
$75,000 + |
15% |
24% |
Source: U.S. Census 2000, CTOD
Figure 12: Station Area and Regional Household Type Distribution, 2000
|
Household Type |
Station Areas |
Region |
|
Single & Non-Family |
58% |
40% |
|
Married Couple Family |
34% |
52% |
|
Other Family |
7% |
8% |
Source: U.S. Census 2000, Center for TOD
Figure 11 compares the income distribution in the region’s station areas to the regional income distribution in 2000. The region’s station areas accommodated a significantly larger share of low-income households compared with the region, with nearly 30 percent of households living near transit earning less than $20,000, and over half of households near transit earning less than $35,000. Households near transit were also more likely to be living alone or in non-family household types (Figure 12), but the difference in household size alone does not explain why households near transit were more likely to earn less. Nearly 40 percent of single and non-family households near transit earned less than $20,000, compared with 30 percent of the same household types region-wide.
While Portland has been more successful than other regions at building a large supply of transit-rich, compact housing units over the last decade, the new market-rate units built at the height of the housing boom are still priced out of reach of most working families in the Portland region. In mid-2007, at the peak of the market in Portland, the median home resale price was approximately $305,000, out of reach for households making less than $55,000 per year. Meanwhile, a household renting a newer unit in the region would have to earn over $35,000 to afford the $1,044 median rent.9 Affordability of homes and apartments in transit rich areas, however, can be enhanced by reduced transportation costs.
Therefore one of the key challenges that future TOD implementation will need to address is fostering new transit oriented housing that is affordable to the workforce. Indeed, nearly two-thirds of the forecasted TOD demand in the Portland region will be among households earning below $50,000.10
Mixed income housing is a key strategy for offering households of all incomes the opportunity to live near, and benefit from, transit. Economically diverse neighborhoods tend to be more stable than those with concentrated low-income populations and support and foster greater opportunities for upward economic mobility.11
Research also shows residents in TOD communities spend a lower percentage of household income on transportation and housing, and ride transit more. See Figure 13.
Figure 13: Income levels and mode share for the region and station areas
|
Geography And Income Level |
Share of Region |
Total |
Total |
Total Bike/Walk |
|
All Incomes |
||||
|
Portland Region |
100% |
951,430 |
6% |
4% |
|
Station Areas |
10% |
96,237 |
12% |
10% |
|
Under $25K income |
||||
|
Portland Region |
44% |
422,097 |
8% |
6% |
|
Station Areas |
5% |
49,691 |
15% |
13% |
|
$25K - $50K Income |
||||
|
Portland Region |
35% |
333,982 |
5% |
2% |
|
Station Areas |
3% |
32,272 |
10% |
7% |
|
$50K - $75K Income |
||||
|
Portland Region |
13% |
119,743 |
4% |
2% |
|
Station Areas |
1% |
8,981 |
6% |
6% |
|
Over $75K Income |
||||
|
Portland Region |
8% |
75,646 |
3% |
2% |
|
Station Areas |
1% |
5,235 |
6% |
7% |
Source: U.S. Census 2000, Center for TOD
Environmental Leadership, and Clean Air and Water
Click to enlarge
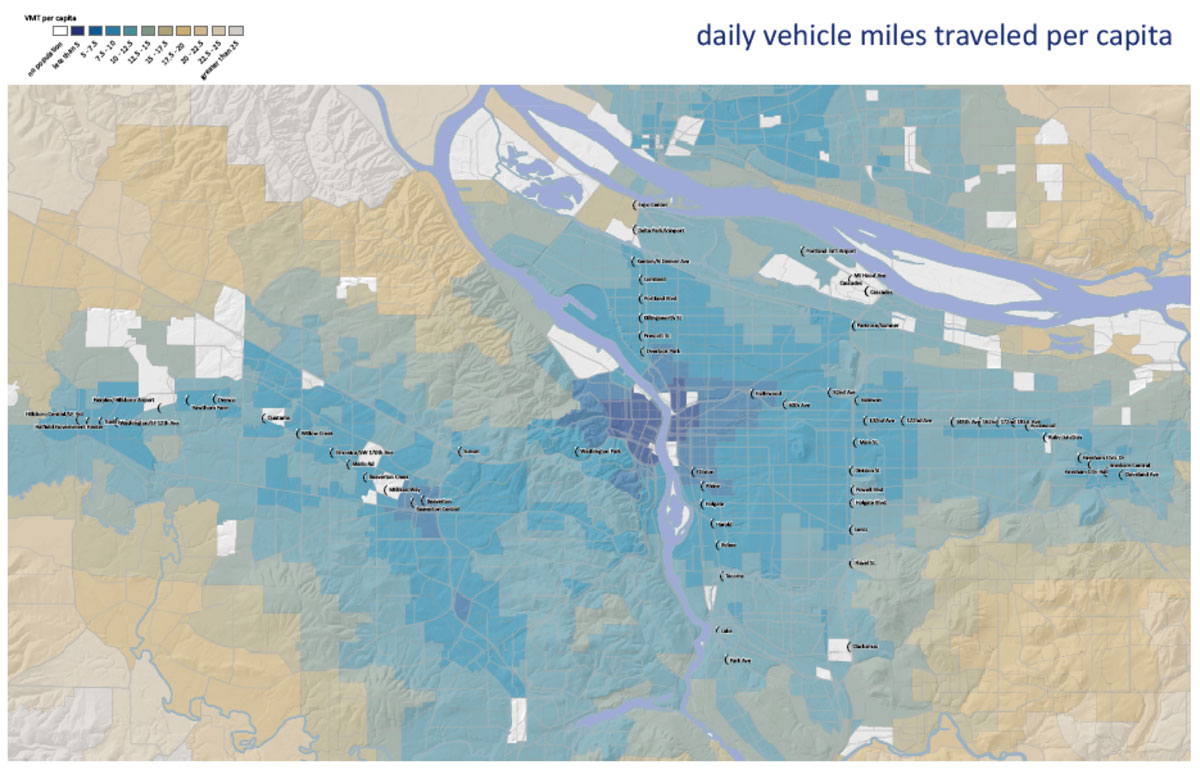
Reducing auto dependence is clearly a key strategy to help achieve several of Metro’s values. Indeed, even with Portland’s history and reputation as a leader in compact development and open space preservation, the transportation sector in Oregon still accounts for 34 percent of carbon dioxide emissions. Reducing vehicle miles traveled in the state’s most concentrated population centers is key to ensuring that residents continue to enjoy a healthy environment even while accommodating much needed economic growth. Transit-oriented development is a proven mechanism for reducing per household vehicle miles traveled, and thus carbon emissions, and an economic development strategy to create vibrant communities. Figure 14 shows that there is a direct relationship between Portland’s transit communities and places where residents have lower per capita VMT. There are many factors beyond transit richness that influence the ability of households to drive shorter distances, and live without a car. Some of the factors that have a proven relationship to vehicle miles traveled performance include:
- Transit connectivity (local and regional)
- Walkability (block size)
- Mix of land uses / Proximity to shopping and services
- Proximity to employment
- Residential density
- Household size
- Cars owned per household12
Transit-oriented development offers tremendous opportunity to influence many of these key factors and potentially reduce vehicle miles traveled. For example, households in Portland’s station areas own an average of 1.32 cars/household, and 62 percent of households have 0 or 1 car available, compared with 1.77 cars/household and 41 percent of households with 0 or 1 car available in the region.13
This discussion of existing conditions in transit and TOD in the Portland region has implications for the design and delivery of the Metro TOD Program into the future. The next chapter addresses the opportunities for thinking about TOD at each station and the region, and making decisions about investments by the Metro TOD Program and other partners.