
Metro’s TOD Program makes small, but highly strategic grants to private developers to promote high quality urban development in transit rich areas. To help ensure that TOD program investments are well targeted to meet program goals as well as broader regional land use and mobility goals, CTOD and Metro TOD Program staff have developed a TOD typology and investment framework. This typology has been developed specifically for Metro’s TOD Program as a tool to guide the types and timing of program investments based on the readiness of transit communities to support urban development that promotes transit ridership and non-auto mobility. The typology allows transit communities to be clustered based on a range of conditions related to transit orientation and market strength, and each cluster is connected to a particular type of appropriate investments to maximize TOD potential.
The TOD typology is a powerful tool to help Metro TOD Program staff to prioritize where and when to make investments, determine the types of investments that are appropriate in varying transit communities, and guide the timing and scale of those investments. The TOD typology is also a dynamic tool, backed by regional data that will be updated over time, allowing the designations for specific station types and corridors to evolve. Although the TOD typology and investment framework is specifically intended to provide direction to the TOD Program, it is important to note that the TOD Program should be considered as only one component of a comprehensive package of TOD implementation tools that Metro and other regional stakeholders can deploy. Achieving Portland’s full TOD potential will require the coordination and involvement of many public and private entities beyond Metro.
The typology is not intended as a tool to evaluate specific decisions related to individual development projects or acquisition of land once Metro staff have determined that those activities are appropriate in the given station area. Recommendations for the evaluation system at the project scale are provided in Chapter IV along with recommendations for other program activities.
What is a Typology?

Click to enlarge
Many cities and regions around the nation have recently turned to typologies as a key tool for structuring short- and long-term investments in transit communities. A TOD typology provides a means of classifying and differentiating the many transit rich communities throughout the region by grouping them based on key shared characteristics. Typologies have seen a variety of uses in different regions. Denver developed a TOD typology to provide a vision for the density and land use mix that would be appropriate in each of the city’s existing and planned light rail station areas. The typology was a guide for subsequent detailed station area planning studies. In Baltimore, a typology was developed to identify and assign station area investment needs to a broad range of TOD actors and stakeholders including affordable housing developers, the State of Maryland, the City of Baltimore and its surrounding counties, and non-profit and philanthropic groups. This typology was folded into a broader TOD Strategic Plan that has enabled Baltimore to more systematically fund transit-supportive projects, rather than continuing the historic practice of investing in a less effective, piecemeal fashion.
Investment Framework Overview
To prioritize station areas for investment in TOD, this framework evaluates the current physical, economic, and demographic characteristics of transit communities throughout the region. The TOD Investment Framework has two primary components:
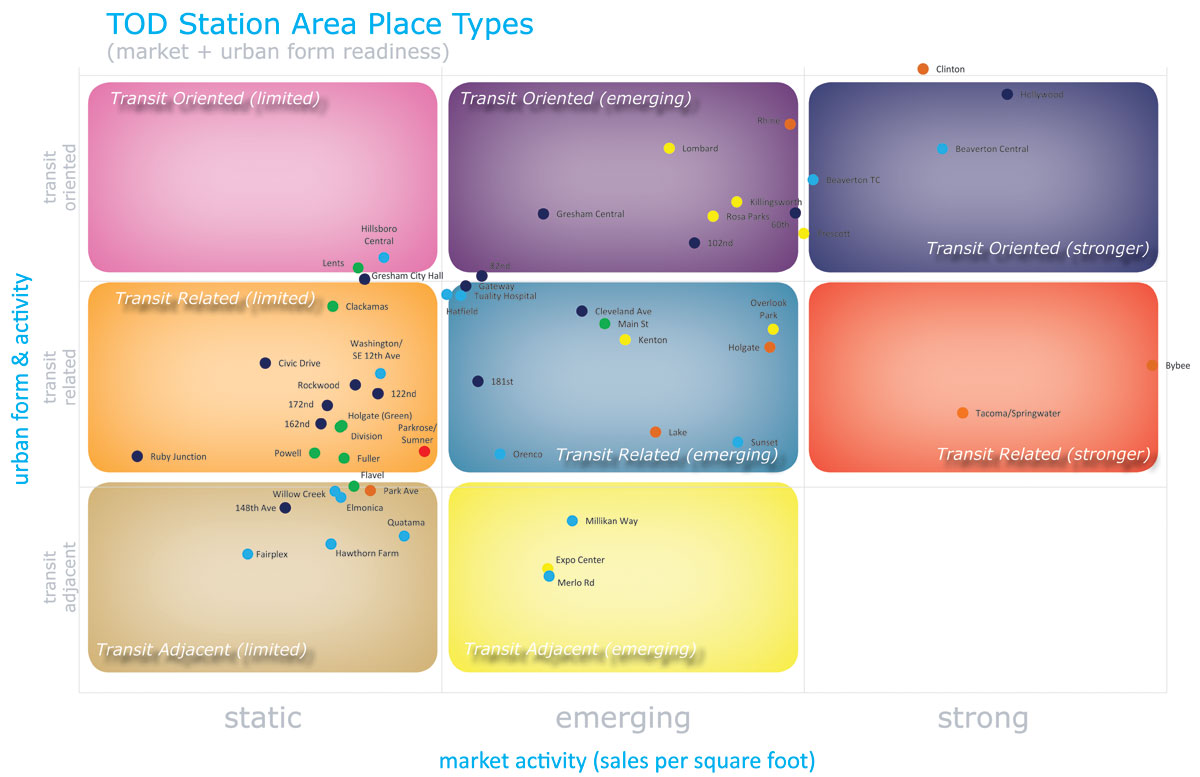
- The place types divide the transit communities into nine categories that connect the market and urban form characteristics of each area.
- Similar place types are grouped into clusters to offer a general overview of the types of actions appropriate for each. This also allows new programs or activities to be introduced where appropriate to maximize future TOD potential.
The framework is then used to make recommendations on the phasing of investment activities and a description of how these investments can be made.
Typology: Market Strength and Transit Orientation
The typology divides transit communities into nine distinct types based on two key variables: relative market strength, and transit orientation. These variables were chosen to capture development potential and transit supportiveness through modeling market and urban form characteristics. Most of the TOD Program’s strategies are intended to work in areas where small programmatic investments can catalyze a much more significant transformation in terms of development activity, travel behavior, community support, and/or physical transformation of a district. To be effectively catalytic, the program’s investments are best suited for those transit communities with some existing local strengths.
Market Strength
The strength of the real estate market in a particular transit community is a significant determinant of the type of investment that might be made by the TOD Program. It is difficult for the TOD Program to catalyze private development in an area with limited or no existing market activity. Conversely, an area with strong market activity may not need the same level of intervention to attract development or encourage desired building types. Emerging areas that have some market strength, but few successful urban, mixed use buildings, on the other hand, may be ideal candidates for TOD Program investment. Here, program intervention can help to push a ripening market and escalate development intensity and quality since higher density mixed-use building types cost significantly more to build on a per square foot basis.
The market strength component of the typology is determined using data on residential (including mixed use) and commercial real estate sales by square foot from around the region.14 This is a common measure of market strength that offers a uniform data source for the entire region. This measure uses all real estate transactions that occurred between 2000 and 2010 for residential and mixed-use (residential/commercial) land uses. This decade-long time frame enables the sales transactions to span several market cycles, offering a more normalized, long-range look at performance. The typology divides market strength into three categories: Limited, Emerging and Stronger. The division between each category is based on natural breaks in the sales data.
- Limited: these areas have weaker market conditions and lack the sales values necessary to support new compact and/or mixed use development. TOD Program investments in these areas, thus, are less likely to catalyze additional private development and should be used only on a limited basis. Emphasis on visioning and planning is more appropriate to begin to develop physical and regulatory conditions that could influence future private development interest.
- Emerging: these are areas that have limited to moderate real estate market conditions and where intensive building types are generally not supported in the near-term. Although they may lack immediate market support for TOD, emerging areas may be ideally suited for catalytic TOD Program investments to enhance local market strength. These areas represent a “sweet spot” for TOD program investment, since land and development costs are not elevated (as in Stronger market areas) and small investments may catalyze further market investment by creating market comparables.
- Stronger: these are areas where market conditions are beginning to support higher density mixed use development and infill. Since the markets of these areas are already ripe or ripening, TOD Program investments should focus on improving urban living infrastructure (amenities), developing prototype developments for the region and funding more “aggressive” (e.g. more significant increase in density compared to recent development in the area) TOD projects. Low- to moderate-income housing development in these areas may be more challenging due to high land prices, so strong market areas may be an appropriate place for Metro TOD program to support affordable and workforce housing projects.
This approach is not predictive of the financial feasibility of new development in any given category, but rather it provides a relative sense of how any individual area performs relative to the region. Because of its market strength, downtown Portland is excluded from this analysis. A closer look at the areas falling in each category, however, shows that generally there is limited new market-rate development occurring in areas with limited market strength, while emerging and stronger market areas are witnessing some new infill, redevelopment and adaptive reuse activity. Market rate projects in emerging areas are relatively lower density (and a lower cost to build) than those projects being built in stronger market areas. Generally, stronger market areas tend to be closer to the core of the city of Portland and concentrated along the city’s key corridors. A handful of outlying station areas and corridors, often close to historic centers, also fall into the stronger and emerging market categories.
Transit Orientation
While the market strength metric provides a rough measure of compact development feasibility based on local real estate conditions, it does not offer any indication of how supportive the surrounding physical environment is for transit supportive uses, including higher density development with lower parking ratios. Research has shown that a few key measures can strongly predict the readiness of an area to support walkable, mixed-use development and to allow residents to live a transit lifestyle that includes less reliance on a personal automobile. The transit orientation measure is a composite of these important elements of TOD-supportive physical form:
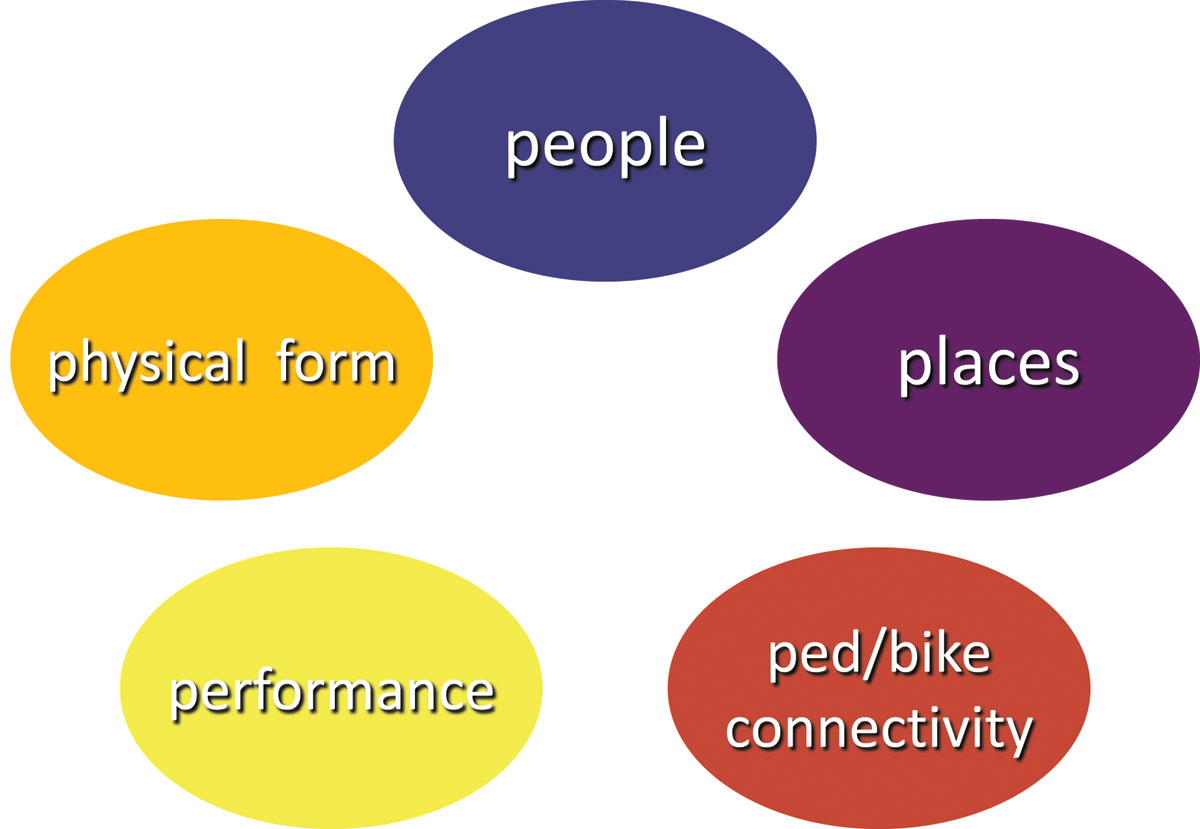
The 5 “P’s” of Transit Orientation
Click to enlarge
Traditionally, true TOD has been said to possess the 3 “D’s” of density, diversity (e.g. mix of uses, age cohorts, income groups), and design (pedestrian scale and orientation). For the purposes of better capturing “urban character” in a composite measure, a more holistic view of the transit friendliness of transit communities is proposed here. The 5 “P’s” used for this analysis are as follows:
- People: The number of residents and workers in an area has a direct correlation with reduced auto trips15;
- Places: Areas with commercial urban amenities such as restaurants, grocers, and specialty retail not only allow residents to complete daily activities without getting in a car, but they also improve the likelihood of higher density development by increasing residential land values16;
- Physical Form: Small block sizes promote more compact development and walkability17;
- Performance: High quality, frequent bus and rail service makes public transportation a more reliable means of getting around and can be correlated to less driving.
- Pedestrian/Bicycle Connectivity: Access to sidewalks and low stress bikeways encourages many more people to walk or cycle to transit and neighborhood destinations.
Some locations may be strong on one or more of the five ‘P’s but weaker on the others. Figure 17 shows thre different station areas evaluated based on their ‘P’s. It is useful to look at both the composite score for each station area, as well as the factors in which each is strong or weak. Relative to station areas outside of downtown Portland, the Merlo Road station area scores low on every dimension of the 5 ‘P’s, while the Hollywood Station has a much higher overall score. However, even in the Hollywood station area, there is room for continued improvement.

Click to enlarge
Transit Orientation Scores

Click to enlarge
Figure 19: Transit Orientation Score in 3D, as viewed from the southeast.

Click to enlarge
Figure 18 is the composite, or Transit Orientation Score, map of the 5 P’s for the region. The region’s diversity is reflected in the range of scores, from “transit oriented” areas with a strong combination of the five factors delineated above to “transit adjacent” communities where transit service is or would not be supported by the surrounding built environment. Figure 19 shows the Transit Orientation Score in 3D, which more clearly displaces the relative readiness of different areas to support transit-oriented development.
- Transit Oriented: Areas that are most likely to support a transit lifestyle. Describes more densely populated areas served by high quality rail and/or bus transit, good to excellent pedestrian/bicycle connections, a finer grain of blocks, and a supportive mix of retail and service amenities.
- Transit Related: Areas that possess some, but not all, of the components of TOD. Generally describes moderately populated areas served by higher quality transit, a good or improving pedestrian/bicycle network, and some mix of neighborhood supportive retail and service amenities.
- Transit Adjacent: Non-transit areas or areas proximate to quality transit without possessing the urban character that would best support it. Generally describes low to moderately populated areas perhaps within walking distances of higher quality rail stations or bus stops, but lack a combination of the street connectivity, pedestrian and bicycle facilities, and urban amenities to more fully support the level of transit service.
Note that transit communities that score well are not limited to close-in Portland neighborhoods. Many outlying transit communities, especially those in or near the historic downtowns of suburban communities, also exhibit strong blends of the 5 P’s.
Combining Transit Orientation with Market Strength
While some transit communities enjoy both strong market activity and transit orientation, others may be strong on one measure but moderate or limited on the other. The performance of each transit community against these measures has implications for the types and timing of TOD Program investments. Figure 20 overlays stronger market activity (real estate sales per square foot > $200) and transit orientation scores for the region’s transit communities. The overlay of transit orientation and market strength lays the foundation for the TOD Program’s investment typology, illustrated in Figure 21.

Click to enlarge
Click to enlarge